Agentic AI for your company's data

AI agents investigating your data. Without paying per token.

Ask a question in plain English and Luminy investigates step by step until it reaches the answer, in dashboards with the exact numbers from your own database. Without opening the database to the AI, with no technician in the middle and no per-user cost.

In use at companies with more than US$ 1.4 billion in annual revenue.

Answers expire. Understanding compounds.
Why AI still hasn't reached your company's data

Three locks keep AI away from your data. Luminy removes all three.

The lock

“I want AI agents on my data, but I can't open the database to an AI.”

IT and legal block the project, over confidentiality, privacy law and risk.

With Luminy

Agents that investigate without accessing the database

The AI builds the queries and reads only the results, never the records. The database stays where it is.

The lock

“Every new question becomes a ticket in IT's queue.”

The ready-made dashboard can't answer the next question, and the analyst becomes the bottleneck.

With Luminy

Any question becomes a dashboard, with no technician in the middle

People ask in plain English and get the chart with the exact numbers from your database, ready to explore.

The lock

“The AI bill keeps growing and nobody knows what was asked.”

You pay per token and per user, and usage goes unchecked.

With Luminy

No per-user cost and no token charges

Every query is logged. The company measures usage and watches its people ask better and better questions.

It all starts with a question

When you start exploring data, you still do not know where the problem is.

That is why asking a specialist for a report does not help, and neither does asking an AI that answers in text: both require you to already know what to look for. What works is a new way of looking, where you find out what matters while you look. See it below.

date, sales rep, sales in 2026
The question does not change. Only the way of looking.
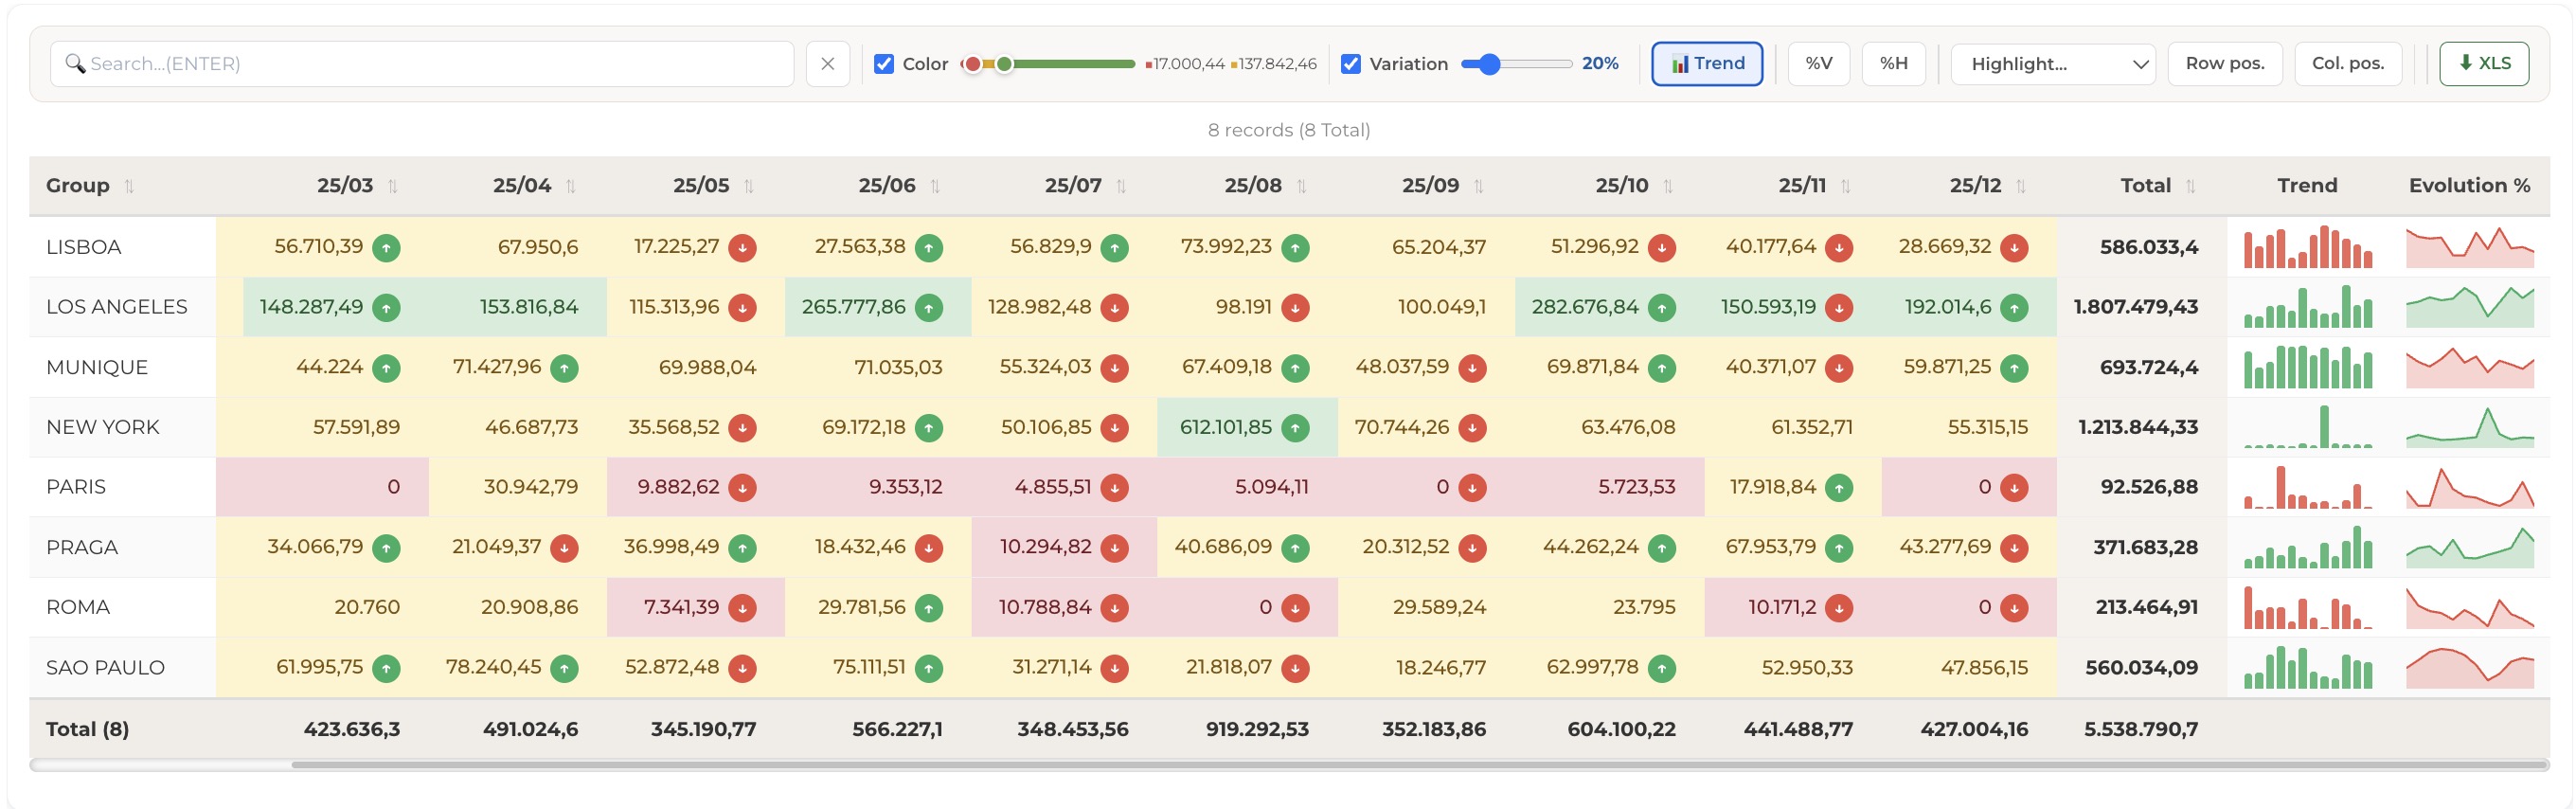
Luminy grid crossing 17 sales reps by month, with colour bands, variation, trend and a total row
One sentence became a cross table of 17 sales reps by 7 months. The total row shows the drop: from R$443k in May to R$128k in July. That it fell is clear. Who caused it is scattered across 119 numbers.
The same question exploded into one bar chart per sales rep, each with a peak and an average line
One click, and every row of the grid became a chart. Jack went from R$91k in January to R$4.8k in July. Denzel collapsed after May. None of this was asked again — only the way of looking changed.

Change the fields in the question, their order and the chart type to produce a completely different result. With no technical knowledge. With no one helping you.

It is you learning from the data, asking better every time.

Why it is not a chat

Text ends the conversation. A chart is where it begins.

The difference between asking an AI and asking here is not in the answer — it is in what you can do with it once it shows up. Text you read. A chart you handle.

Answer as text

Ends where it appeared

You ask
Back comes a paragraph with a number inside
The end

To look from another angle you have to formulate everything again — and writing the right question requires exactly what you do not have yet: knowing where the problem is.

Nobody learns by reading answers. They learn by handling them.
Want to see the mechanics from the inside?
Features and the video catalogue
The gap between the answer and the decision

Your company already has the data source. What is missing is a layer.

Where Luminy sits
01
Source

Business systems

ERPs, CRMs, operational systems and external sources.

02
Data

Data lakes and databases

Data is gathered, organised and prepared.

03
Answers

BI, spreadsheets and AI

Every question becomes a report, a chart or a paragraph. And it ends there.

BI stops here
04
Luminy

Understanding layer

Runs on top of what the company already has and reads the data at the source.

05
Decision

Decision makers stop waiting

Understanding stops being concentrated in a handful of specialists.

How understanding builds up
WEEK 1

Library

The questions that paid off become your personal library.

WEEK 4

Dashboards

Library items come together into dashboards ready to consult.

WEEK 12

Your own engine

You build your own query engine, entirely on your own data.

You understand, you get used to it and you start building — without waiting for the next release.
IT's first question

Does the data leave the building? It stays right where it is.

No migration, no new data warehouse, no six-month project before the first question. Luminy reads what already exists, where it already is. What changes is not the infrastructure. It is who gets to ask.

Connect

The data stays where it already is

Direct connection to the databases and Data Lakes where the company already brings together the data from all its systems. No parallel copy to maintain, no new environment to provision, no queue with the data team before you start.

Nothing is rebuilt
Organize

Technical names become business names

Tables, fields and metrics are mapped to the words people actually use. That is why “sales in 2026” finds the right answer without anyone writing a query.

Done once, valid for the whole company
Protect

The AI does not read your records

The AI understands the question and builds the query, but never accesses the database or reads records. When it investigates, it sees only the query totals. Your records train no model and stay in an environment you choose, inside your company or on a dedicated server.

None of your data becomes model training
Where Luminy reads from
XLS
Spreadsheets
The files the team already uses, to start without waiting on IT.
DB
Databases
SQL Server, PostgreSQL, Oracle, MySQL and others.
DL
Data Lakes
The environment the company already built, or one built for it.
API
External sources
APIs and complementary market data.
Your ERP's AI
Sees only what is inside the ERP.
Luminy
Reads the database where all your systems already come together.
For teams that already have BI

Is your BI built on SQL statements? Luminy accepts yours.

In Luminy, a question can also be a SQL query or JSON data, returned as a chart, ready to explore, switch views and see from other angles, like any other answer.

SELECT seller, month, SUM(amount) …
Chart ready, no dashboard to build
Who it is for

The same data source serves the C-level, the manager, the analyst and the salesperson in the field.

It is not a tool for the data team to operate on behalf of everyone else. We created different ways for each person to get the most out of the platform, according to the specific needs of each role.

Industries where Luminy already runs successfully
Retail Manufacturing Healthcare Finance Services

600 store supervisors query sales data. None of them goes through an analyst.

In a retail chain, the people who run the stores ask the numbers directly and get the answer as a dashboard. That is how understanding spreads across the company.

Real case · Retail
Next step

The best proof is looking at your own numbers.

The tour runs on a demo dataset and answers most questions without you talking to anyone. After that, the only conversation worth having is about your data.

With the person who built it

Talk about your data

You will be talking to Marcus, Luminy’s founder. The conversation is about where your data lives, what can be answered in the first week and what a proof of concept would look like in your operation.

A direct conversation, with no sales script.
Are you a consultancy, integrator or channel? The licence opens the door; services build the ecosystem around it. See the partner model →

With every interaction, you understand more.

Luminy · The understanding layer